Semantic Smart Readiness Indicator Framework
Abstract
The Smart Readiness Indicator (SRI) is an energy rating scheme targeted at buildings to evaluate their capacity to integrate and benefit from smart technologies for enhanced energy efficiency and overall performance. Existing tools for SRI assessment and rating do not provide a standard format for data exchange. However, there are several scenarios in which a FAIR, standardised data format is beneficial, such as data exchange between building tools, comparison of different assessments, or computing statistics about buildings.
1 Introduction
As part of the efforts to reduce greenhouse gas emissions, the European Union has defined specific measures to make buildings more energy efficient, which are crucial to achieving the EU’s goals of increasing the energy efficiency of Europe in all sectors by at least 32.5% by 2030.1 These measures are outlined in the Energy Performance of Buildings Directive (EU 2018/844) [1]. In particular, the potential of smart technologies in the building sector is heavily emphasised, and the concept of the Smart Readiness Indicator (SRI) is introduced.2 The SRI rates buildings according to their “smartness”, i.e. their ability to sense, interpret, communicate, and actively respond in an efficient manner to changing conditions in relation to:
- the operation of technical building systems;
- the external environment (including energy grids); and
- demands from building occupants.
The SRI rating scheme aims to raise awareness of the benefits promised by smart building technologies and to encourage building renovations.
Currently, a building’s SRI assessment and rating is done manually by a certified SRI assessor – a task that takes hours to complete and does not scale over multiple buildings [2]. While there are ongoing work in developing digital SRI tools, they lack standardised formats for data exchange. In particular, none of the tools follows the FAIR principles [3], which put emphasis on enhancing the ability of machines to automatically find and use the data. Nevertheless, we see the benefit of having an interoperable data representation to allow the exchange and reuse of SRI data among different applications in the building domain.
We propose a Semantic Smart Readiness Indicator framework, consisting of an SRI information model and a knowledge graph-based SRI calculation. Our work is motivated by and aligned with recent efforts to create semantic data models for buildings. Graph-based building models such as Brick [4] and the Building Topology Ontology [5] capture the rich, formal descriptions of buildings – their architecture, the structure and composition of their subsystems – and have been shown to reduce development time for several different building applications [6].
By providing a semantic representation of the SRI information, our model can be seamlessly integrated with existing building models. Moreover, our knowledge graph-based SRI calculation can natively compute the SRI scores, without the need of any data transformation nor external calculation services, thus avoiding additional maintenance effort. Another benefit is providing a more transparent score calculation process, where we see how the different services contribute to the final score. Aligned with the FAIR principles, our framework supports the exchange and comparison of SRI related data, for example, to share service catalogues, to enable different building analytics tools to make use of the data, thus avoiding vendor lock-in, and to allow the comparison of assessments of a building over time or across multiple buildings.
This paper describes our proposed framework, the ontology engineering process, and the evaluation of both the model and the SPARQL-based SRI calculation.
We summarise our contributions as follows:
We provide a vocabulary to represent the concepts the SRI consists of, including SRI assessments for buildings;
We describe a SPARQL-based SRI score calculation process; and
We leverage the advantages of a knowledge graph and demonstrate how it can be used to answer SRI-related questions.
The remainder of the paper is structured as follows: An overview of related work is presented in Section 2. In Section 3 we provide background information about the smart readiness indicator. The ontology engineering process is described in Section 4, followed by the ontology description in Section 5. The SRI knowledge graph is explained in Section 6. An evaluation of our framework is given in Section 7. Finally, Section 8 concludes the paper.
3 Smart Readiness Indicator
| Impact Criteria Points | |||||
|---|---|---|---|---|---|
| # | Description of service level | Energy efficiency | Energy flex. & storage | Comfort | … |
| 0 | No automatic control | 0 | 0 | 0 | … |
| 1 | Central automatic control (e.g. central thermostat) | 1 | 0 | 1 | … |
| 2 | Individual room control (e.g. thermostatic valves, or electronic controller) | 2 | 0 | 2 | … |
| 3 | Individual room control with communication between controllers and to BACS | 2 | 0 | 2 | … |
| 4 | Individual room control with communication and occupancy detection | 3 | 0 | 2 | … |
The SRI is a common EU scheme for rating the smart readiness of buildings. The core idea of the SRI is that smart buildings are capable of providing services, which are described with a technology-agnostic name. Each service has different levels of maturity, and each maturity level, in turn, has impact points with respect to different impact criteria [2]. An example for the service “Heat emission control”, with three of the impact criteria and five maturity levels is shown in Table 1. The five maturity levels range from 0 (“No automatic control”) to its most mature level 4 (“Individual room control with communication and occupancy detection”). Each service belongs to a technical domain and influences one or more impact criteria, depending on the service level. There are a total of nine domains and seven impact criteria. In the example, the impact points for the maturity levels range from 0 to 3. As one can see, the number of impact points of a given maturity level is highly dependent on the impact criteria itself. For instance, the service in the example has an impact on “Energy Efficiency” and “Comfort” but does not impact “Energy flexibility and storage”. Moreover, an increase to maturity level 2 already creates the highest impact for “Comfort”, while maturity level 4 is required to reach the highest impact for “Energy efficiency”. A collection of services is called service catalogue. Depending on the context of the building, some of the services of the service catalogue might not apply.
Given the service catalogue, and the building to be rated, the assessment and SRI score calculation is a multi-step procedure as follows [2]:
- Step 1
-
A triage process define the relevant SRI services for the building;
- Step 2
-
For each SRI service, its maturity level is assessed;
- Step 3
-
Given the services and their levels, the impact criteria scores are calculated;
- Step 4
-
The maximum impact scores for each domain-impact combination is calculated, and the SRI score is given as a percentage of the maximum achievable score;
- Step 5
-
For each impact, the total weighted score is calculated based on the results from Steps 3 and 4 and the impact weights;
- Step 6
-
The impact scores are aggregated along the three key capabilities;
- Step 7
-
The key capability scores are aggregated to calculate the total smart-readiness score;
- Step 8
-
As an optional step, the scores for each domain / impact combination are calculated.
The first step is the triage process, which allows for the exclusion of individual services and domains from the assessment process without having a negative impact on the SRI score, e.g., heating is not required for buildings in South Europe, and the lack of heating therefore should not have a negative impact on the SRI score. The second step is the actual assessment process in which the assessor goes through the services offered by a building and decides their maturity level.
| IMPACTS | ||||||||
|---|---|---|---|---|---|---|---|---|
| DOMAINS | Energy efficiency | Maintenance & fault pred. | Comfort | Convenience | Health & well-being | Information to occupants | Energy flex. & storage | SRI |
| Heating | 32% | 18% | 62% | 55% | 24% | 74% | 0% | |
| Hot water | 17% | 0% | 45% | 70% | 67% | 83% | 0% | |
| Cooling | 65% | 51% | 78% | 72% | 61% | 55% | 0% | |
| Controlled ventilation | 41% | 0% | 55% | 60% | 34% | 44% | 0% | |
| Lighting | 85% | 14% | 90% | 100% | 83% | 15% | 0% | |
| Dynamic envelope | 10% | 0% | 31% | 56% | 22% | 46% | 0% | |
| Electricity | 10% | 0% | – | – | – | 68% | 0% | |
| EV charging | – | 38% | – | 82% | – | 84% | 0% | |
| Monitoring & control | 52% | 43% | 62% | 72% | 45% | 64% | 0% | |
| TOTAL | 39% | 18% | 60% | 71% | 48% | 59% | 0% | 42% |
The actual calculation process of the different scores, based on the assessment, starts with the third step. First, the impact of a selected service maturity level is calculated as a percentage of the maximum impact points for that service. Subsequently, the impact criteria scores are weighted on the nine domains as shown in Table 2 . The weights depend on the type and location of the building. Finally, individual scores are aggregated into three key capability scores, which contribute equally, i.e., each, to the final SRI score. The three key capabilities [1] refer to the abilities of a building to:
- react to changes in the energy consumption;
- react to the needs of occupants; and
- participate in an energy grid.
This multi-step SRI calculation process results in an SRI score for a building [2].
Currently, the SRI framework is in a test phase, in which thirteen EU countries are participating5. According to a recent newsletter from the European Commission, large non-residential buildings must adopt the SRI schema by June 20276. In response to this newly introduced building rating schema, and aligned with existing efforts on providing a semantic representation for buildings, our Semantic Smart Readiness Indicator framework provides an information model to represent both the SRI catalogue and the building assessment.
The ontology engineering process to create the model is described next, followed by a description of the model itself. Our SRI calculation method is based on SPARQL queries to the SRI knowledge graph, which will be described in more detail in Section 6.
4 Ontology Engineering
For the development of the ontology we followed the Linked Open Terms (LOT) methodology [15]. LOT splits the ontology development in four consecutive activities, namely,
- ontology requirements specification;
- ontology implementation;
- ontology publication; and
- ontology maintenance.
These are described in this section.
4.1 Ontology Requirements Specification
We start with the definition of the scope of the ontology by describing the use case, its requirements, and the definition of competency questions which should be possible to answer with our proposed ontology.
Use case specification.
The SRI scheme is meant to incentivise buildings to become “smarter” and, consequently, more energy efficient. SRI assessments and scores serve as a comparison measure across buildings in terms of their capabilities. Moreover, they can be used as input to building analysis applications, for example, to identify how buildings can improve their capabilities. Therefore, it would be beneficial to have SRI related information available in a format that is easily exchanged and ingested by different building analysis tools. Also, we need the means to compute the SRI scores given this new representation, in order to fully implement the SRI methodology. In order to conform with the latest recommendations on data exchange, the SRI-related information model should follow the FAIR principles for data reuse and exchange. The FAIR principles correspond to findability, accessibility, interoperability, and reusability, as defined in [3]. In addition, given the availability of widely-used semantic building model, it is desirable the SRI information be easily integrated to existing building models. Furthermore, as buildings are supposed to be assessed multiple times over their lifetime, provenance information is important. Lastly, the SRI concept is designed to be adaptable to different situations and buildings, therefore it is crucial any adjustment to the SRI scheme be easily incorporated into the SRI model.
Requirements.
Based on the use case specification, the SRI information model should meet the following requirements:
- R 1
-
It should allow to represent SRI assessments semantically;
- R 2
-
It should record SRI assessments’ provenance;
- R 3
-
It should allow customisation to reflect the national SRI implementations;
- R 4
-
It should allow a semantic-based SRI score calculation, according to the EU’s scores definition;
- R 5
-
It should follow the FAIR principles; and
- R 6
-
It should be easily integrated into existing building models such as BRICK and BOT.
Competency questions.
The ontology creation process is driven by the following competency questions to ensure we cover all the required information:
- CQ 1
-
For a given building, who performed a given assessment and when?
- CQ 2
-
What is the total SRI score resulted from a given building’s assessment?
- CQ 3
-
What are the SRI impact scores of a given assessment?
- CQ 4
-
What are the SRI scores for the different SRI services of a given building and assessment?
- CQ 5
-
For a building with at least two assessments: how did the SRI score change?
The first competency question relates to provenance information, namely, knowing who performed a building assessment and when, as buildings will be assessed multiple times, e.g., after new building equipment is installed. Competency questions 2–5 are targeted at the different scores generated during the calculation process, as explained in Section 3.
4.2 Ontology Implementation
For the SRI ontology we reuse modelling approaches and concepts from different existing vocabularies and ontologies (R 1). We chose the RDF Data Cube Vocabulary (QB) [16] as a basis for the SRI vocabulary. The QB vocabulary is built to represent multidimensional data such as statistical data in RDF. QB provides a modelling approach for hierarchical dimensions, measures, and attributes. This multi-dimensional modelling approach allows to represent the different data sets needed for different tasks in the SRI framework, particularly for the SRI score calculation process. We give definitions for four different data cubes in so called Data Structure Definitions (DSD). We define dimensions, measures, and attributes necessary for these DSDs. To represent hierarchical dimensions we use the Simple Knowledge Organization System (SKOS) [17] as recommended by the QB vocabulary. For use of the SRI vocabulary we recommend to use W3C PROV [18] to express metadata of the data cubes and relationships between data cubes, as we do in our knowledge graph (see Section 6) (R 2). The vocabulary is described in detail in Section 5. The ontology is encoded in Turtle syntax, created by Protege7 and text editors. More details on the ontology evaluation process and results are presented in Section 7.
4.3 Ontology Publication and Ontology Maintenance
We published the ontology on GitHub and used OnToology [19] to support the ontology engineering process. The tool automatically does syntax checks, generates documentation, diagrams and a JSON-LD context. We registered the URI8 as a permanent URL for our vocabulary and set up HTTP content negotiation to provide either the HTML documentation or the vocabulary in Turtle, N-Triples, RDF/XML and JSON-LD syntax, depending on the Accept HTTP header. We published the GitHub repository to Zenodo for permanent publication and for obtaining a Digital Object Identifier (DOI).We have submitted our vocabulary to prefix.cc and the Linked Open Vocabularies (LOV) registry [20] to increase its visibility and findability.(R 5) We have used FOOPS! [21] to evaluate our ontology with respect to fulfilling the principles of FAIR [3] data sharing. More details can be found in Section 7.
The vocabulary is now in the maintenance phase. We are collecting feedback in issues of the GitHub repository9 and plan to integrate updates in the future. In the next section we describe the main artefact of this methodology, the Smart Readiness Indicator Vocabulary, in detail.
5 Smart Readiness Indicator Information Model

Figure 1 depicts an overview of the result of the ontology engineering process, namely, our SRI vocabulary. We start with the definitions of the concepts which are instantiated later. In our model, these definitions include RDFS/OWL term definitions (classes, object properties and data properties), QB data cube definitions (DSDs, dimensions, measures, and attributes), and dimension hierarchies with SKOS. The definitions are formalised in the SRI Vocabulary.
Concept Instantiation Responsibilities
Different official entities, namely the European Union, the EU member states and the SRI assessors, are responsible for defining the concrete entities, instances and values. In Figure 1, the different responsibilities are indicated by the background colours, as explained below.
Entities instantiated by the EU in their directives and publications correspond to the nine technical domains, the seven impact criteria, the three key capabilities, and the five maturity levels. Since these instances are not subject to change by countries nor assessors, they must be reliably available to everyone. The instances are thus part of the SRI Vocabulary, and highlighted with a blue background in Figure 1.
Classes and data cubes, which are to be defined by the EU member states implementing the SRI, are the services, a service catalogue as well as the corresponding impact points and weights for the SRI calculation. These instances are highlighted with a red background in Figure 1 (R 3).
PREFIX sri: <https://w3id.org/sri#>
PREFIX rdf: <http://www.w3.org/1999/02/22-rdf-syntax-ns#>
PREFIX rdfs: <http://www.w3.org/2000/01/rdf-schema#>
PREFIX qb: <http://purl.org/linked-data/cube#>
PREFIX prov: <http://www.w3.org/ns/prov#>
PREFIX dcterms: <http://purl.org/dc/terms/>
PREFIX skos: <http://www.w3.org/2004/02/skos/core#>
PREFIX xsd: <http://www.w3.org/2001/XMLSchema#>
PREFIX foaf: <http://xmlns.com/foaf/0.1/>
During a building assessment, the SRI assessor records data about buildings and the assessments itself. Once the assessment is complete, the scores can be calculated. These concepts are thus instantiated during assessment and are highlighted in green in Figure 1. Furthermore, we also introduce the namespaces used for all examples in this paper as indicated in Figure 2.
SRI Vocabulary
The SRI Vocabulary is defined in a lightweight OWL ontology based on the RDF Data Cube Vocabulary [16]. The vocabulary defines the structure of the four QB datasets, i.e. the service scores sri:dsd-sriscores and weight matrices sri:dsd-weights for the service catalogues, a well as the assessments sri:dsd-assessments and scores sri:dsd-scores for the actual building assessments. The dimensions needed for the definition of the DSDs are shown as dashed lines in Figure 1. The dimensions for functionality and impact are hierarchical, each with a top concept on their own. Regarding functionality, each technical domain contains several services. For impact, it means that each key capability contains one or more impact criteria. As recommended by the QB specification, the hierarchy is represented as a SKOS hierarchy with skos:narrower.
A sri:ServiceCatalogue contains an arbitrary number of sri:Services. Each service can have multiple levels of maturity, with their corresponding impact points on the impact criteria (see example in Table 1).
The weight matrix (dsd:weights) needs to be defined by the member state. Adaptability is ensured by enabling member states to create as many different service catalogues, services, and weight matrices as they require. The definitions of the service catalogue (sri:serviceCatalogue) and weights (sri:weights) are the basis for the calculation of the SRI scores.
ex:52137378 a qb:DataSet, prov:Collection ;
  qb:structure sri:dsd-assessment ;
  rdfs:label "Assessment Building A" ;
  dcterms:created "2023-01-26"^^xsd:date ;
  prov:generatedAtTime "2023-01-26T18:02:33"^^xsd:dateTime ;
  prov:wasAttributedTo ex:35072a92 ;
  sri:building ex:cce2f0ee ;
  sri:serviceCatalogue sri-ref:scB ;
  sri:weights sri-ref:n-eur-residential .

ex:52137378-9 qb:dataSet ex:52137378 ;
  sri:function sri-ref:h1a ;
  sri:level sri:level1 .

ex:35072a92 foaf:name "Billy McEssor" .
The class sri:Building serves as a natural extension and alignment point for existing building vocabularies/ontologies, e.g., bot:Building, brick:Building, or s4bldg:Building (R 6). An SRI assessment consists of two QB datasets (shown in green in Figure 1) with their corresponding metadata. One dataset (sri:dsd-assessment) represents the assessment, as created by the assessor, essentially observing for each service how smart-ready the building is equipped. As recommended by the QB vocabulary, standardised metadata can be attached to the data cube, using Dublin Core Terms or PROV, for example, to record the date and the assessor. The other dataset (sri:dsd-scores) represents the scores as calculated by the SRI score calculation process, explained in detail in the next section. An assessment is connected to a building using sri:building. The scores are connected to the building (sri:building) and the assessment (prov:wasDerivedFrom). The separation of the assessments and scores enables a “copy&edit” process, in which an assessment is duplicated without scores so that it can be changed afterwards, for example, to correct a mistake in the assessment or to update it after building improvements. In this case, the original and all derived assessments are connected using the predicate prov:wasDerivedFrom. By doing so, our model allows for the easy tracking of the history of the SRI assessments over time including information about responsible persons.
Finally, Figure 3 shows an example of an SRI assessment. In this example, ex:52137378 is the dataset for the assessment, including links to the building, the service catalogue, the weights, and the assessor information. ex:52137378-9 is an example of a service assessment (service H1a), and its respective SRI service maturity level (sri:level level1). This assessment has been created by assessor ex:35072a92.
6 SRI Knowledge Graph and SPARQL-based SRI score calculation
Bases on the SRI framework, our KG contains the SRI vocabulary, the reference data, as well as all data related to a building assessment. This section describes the construction of the knowledge graph, custom extensions necessary in our use case, such as the services and weights currently used in the SRI test phase, and the SPARQL-based SRI score calculation process.
6.1 Knowledge Graph Construction
In a first step we initialised the knowledge graph with the SRI vocabulary and the reference data. Besides the instances already contained in the vocabulary, we specify the service catalogue, a data cube for the SRI impact scores and a data cube for the weights. We use the PROV-O ontology [18] to represent provenance metadata. Specifically, we record who created which data cube at what time (see Figure 3 for an example). We use a standard SPARQL triple store to store the different graphs. The vocabulary and each data cube are contained in a separate named graph for easier data management. For the data cubes, the name of the graph is the same URI as the data cube, i.e., the instance of qb:DataSet.
Regarding storage requirements, the SRI related data is not particularly large. The exact size of the KG will depend on the number of SRI services marked as relevant. As an example, for an office building, in which all 54 services were relevant, the SRI information, namely building metadata, SRI assessment and scores’ breakdown, accounts for a total of 700 triples. Currently our KG holds 60 SRI assessments, which sums up to a total of around 107k triples. A few examples can be found online 10. Concerning data quality, we have used existing SHACL shapes provided for the Data Cubes vocabulary, which are available online11. We use these shapes for validating the structure of the RDF data cube instances, for example to ensure there are no duplicate observations and that all necessary dimensions are specified.
6.2 SPARQL-based Score Calculation Process
Once all necessary information is available in the triple store we can perform the SRI assessment and calculation workflow as described in Section 3 (R 4). Before the assessment starts, the assessor needs to describe the building and decide which service catalogue and weight data cube are applicable. The first two steps are then performed by the assessor. Step 1 of the SRI calculation workflow is the triage. The assessor decides which service is necessary for the assessment of the current building. In Step 2, the assessor assesses the building, records the maturity level of each service, and indicate which services are not relevant. As mentioned earlier, we store the assessment data cube in a separate named graph and the name of the graph is the same as the URI of the assessment data cube.
?sds is the scores dataset, ?so is the overall score URI, and ?as is the overall score value.# Step 7 in the SRI methodology
# documented in sections 1.3.6.7 on page 131f in the final report
# available from https://data.europa.eu/doi/10.2833/41100
# "Total smart-readiness score for a building or building unit"
INSERT { GRAPH ?sds {
?so sri:function sri:topDomain ; sri:impact sri:topImpact ;
sri:score ?as ; qb:dataSet ?sds . } }
WHERE { {
SELECT ?sds (AVG(?score) AS ?as) (UUID() AS ?so)
WHERE {
?keycap a sri:KeyCapability .
GRAPH ?sds {
[] sri:function sri:topDomain ; sri:impact ?keycap ;
sri:score ?score ; qb:dataSet ?sds . }
} GROUP BY ?sds
} }With the assessment finished, we proceed to calculate the SRI scores. We implement the remaining six calculation steps of the workflow as a series of SPARQL INSERT queries. Step definitions might consist of aggregation operators, which are implemented using SPARQL aggregation queries. Consider Step 7 as an example to show how the step definition is converted to a SPARQL INSERT query. In Step 7, the scores of the three key capabilities are aggregated to compute the total SRI score for the building. The SRI final report defines Step 7 as follows, where is the total smart-readiness score of a building, is one of the key capabilities , and is the smart-readiness score of a key capability:
Figure 4 shows the SPARQL query implementing this step. Here, we use the AVG function to sum up the individual key capability scores, with equal weights. The SPARQL queries implementing the SRI calculation workflow steps from Step 3 to Step 8 are available online12.
7 Evaluation
We start with the evaluation results for the vocabulary and then describe the KG evaluation which uses the vocabulary.
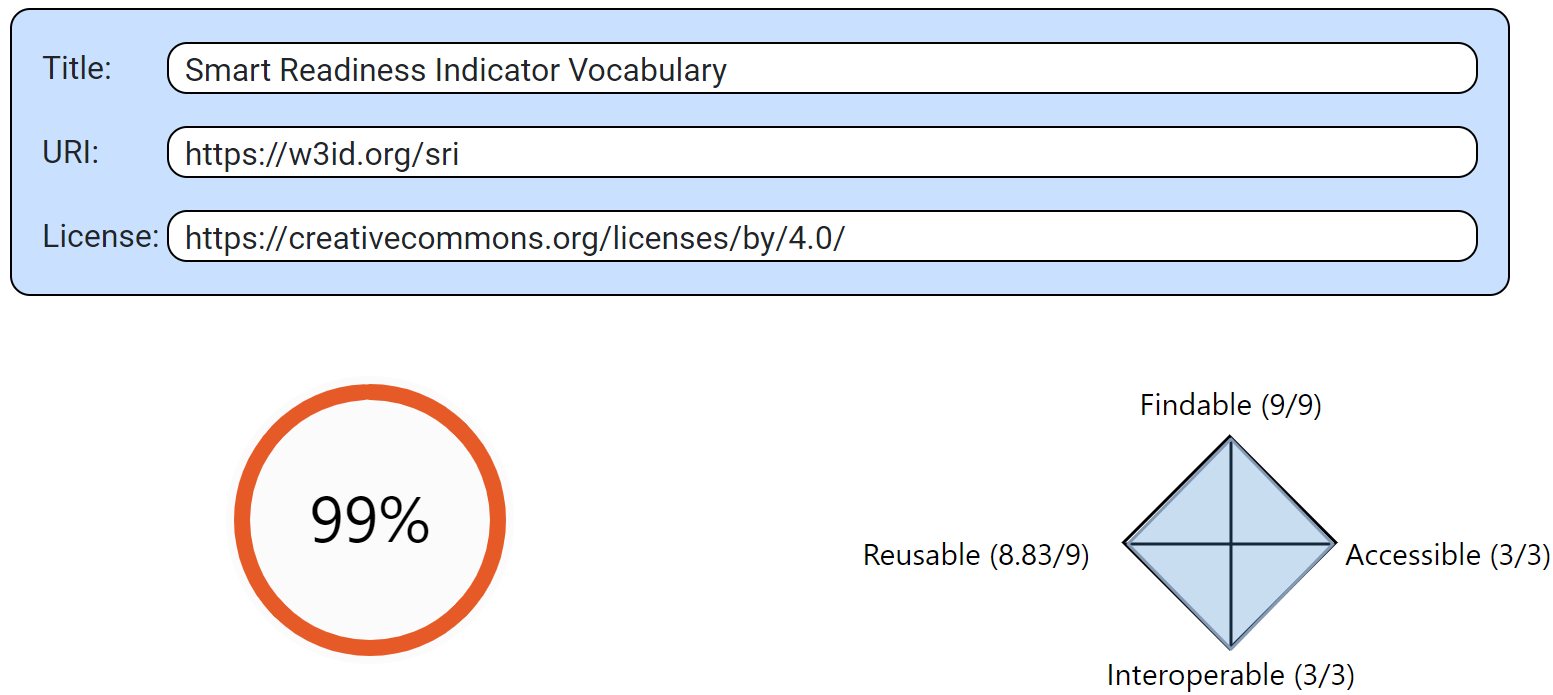
As mentioned in Section 4, we used several tools to ensure a high quality of the vocabulary. To verify the logical consistency, we used the Hermit reasoner from Protege during the ontology encoding process. To evaluate the adherence of the vocabulary publishing step to the FAIR principles, we used the FOOPS! validator [21] (R 5). At the time of writing, the published SRI vocabulary achieved a score of 99% (see Figure 5). FOOPS! currently does not correctly recognise the bibo:status annotation of the ontology13. Once this issue is fixed, we expect the FOOPS! score to reach 100%.
The knowledge graph evaluation process is based on two approaches. In the first approach, we have considered a sample assessment from the official SRI calculation sheet14, which includes the overall SRI score for an assessment, as well as the individual key capability and impact criteria scores. We then recreated the same assessment within our framework and executed our SPARQL-based score calculation process. The results obtained with both the official SRI calculation sheet and our framework were the same, confirming the correctness of our calculation method (R 4).
Our second evaluation approach is based on the competency questions defined in Section 4. The validation consists of providing SPARQL queries that are able to answer the competency questions. Below, we provide answers to all competency questions. Due to space limitations, we only present the SPARQL query that answers CQ 2 in full. The queries to answer all the competency questions can be found online15.
The first competency question (CQ 1) is aimed at providing additional information about the assessor, i.e. who performs the SRI assessment on the building. Each assessment is connected (prov:wasAttributedTo) to an agent. Furthermore, for each assessor, additional information is stored, such as full name, ID, and email address. Our solution enables querying all assessments of a particular assessor, if required, which would be a time-consuming manual process when working with individual Excel documents.
?assessmentIRI corresponds to a assessment and ?score is the overall SRI score for that assessment.SELECT ?score WHERE {
?dataset rdf:type qb:DataSet ;
qb:structure sri:dsd-scores ;
prov:wasDerivedFrom ?assessmentIRI .
?observation qb:dataSet ?dataset ;
sri:function sri:topDomain ;
sri:impact sri:topImpact ;
sri:score ?score .
}The only required input parameter for the query in order to answer CQ 2 is the unique assessment IRI (?assessmentIRI). That means, we replace the ?assessmentIRI variable with a concrete assessment IRI before sending the SPARQL query to the triple store. After the execution of the score calculation process, a new qb:DataSet containing the scores is created and connected to the assessment using the property prov:wasDerivedFrom. The result–bound to ?score–is the smart readiness score of the whole building. Figure 6 shows the SPARQL query to answer CQ 2.
CQ 3 is about gaining more insights into the scores of the seven impact criteria. The query that answers CQ 3 returns the individual impact scores, and provide a quick overview on which areas the building are performing well or poorly. Therefore, these scores can be used to support the decision-making process on which areas further investments should go. Additionally, we sort the results of the impact criteria in the same order as in the official SRI calculation sheet, which is implemented using VALUES with the impact name and sequence number and the ORDER BY clause.
The answer to CQ 4 provides even more detailed information, as it adds the nine domains and presents the scores for all domain-impact combinations for a given assessment. This provides a profound analysis as it pinpoints the weaknesses and strengths of a building, for instance that the domain “Heating” already reaches a high energy efficiency but the domain “Cooling” still has some improvement potential.
CQ 5 targets the scenario in which a building has already been assessed multiple times, for example, when building improvements have been applied. In this case, we would like to compare assessments/scores of a particular building over time. This scenario can be extended to compare different assessments across different buildings.
8 Conclusion
We have introduced a Semantic Smart Readiness Indicator framework to represent SRI related information and compute SRI scores. Our framework is FAIR, flexible to accommodate specific SRI requirements, and can be aligned with existing semantic building models to facilitate data linking and exchange.
In particular, we described our ontology engineering process, which follows the LOT methodology. Additionally, we have implemented a SPARQL-based SRI score calculation process, which makes use of a knowledge graph created following the model. We have also evaluated the ontology and the knowledge graph, using additional external tools, and answering competency questions. The evaluation showed that our proposed information model is not only capable to represent the SRI of a building, but it also provides answers to all our competency questions.
This work was partially funded by the European Union’s Horizon 2020 research and innovation program project PHOENIX under grant agreement no. 893079.
References
- European Parliament, Council of the European Union: Directive (EU) 2018/844 of the European Parliament and of the Council of 30 May 2018. OJ. L 156/75, 75–91 (2018).
- Commission, E., Energy, D.-G. for, Verbeke, S., Aerts, D., Reynders, G., Ma, Y., Waide, P.: Final report on the technical support to the development of a smart readiness indicator for buildings. Publications Office (2020). https://doi.org/10.2833/41100.
- Wilkinson, M.D., Dumontier, M., Aalbersberg, Ij.J., Appleton, G., Axton, M., Baak, A., Blomberg, N., Boiten, J.-W., Silva Santos, L.B. da, Bourne, P.E., others: The FAIR guiding principles for scientific data management and stewardship. Scientific data. 3, 1–9 (2016). https://doi.org/10.1038/sdata.2016.18.
- Balaji, B., Bhattacharya, A.A., Fierro, G., Gao, J., Gluck, J., Hong, D., Johansen, A., Koh, J., Ploennigs, J., Agarwal, Y., Berges, M., Culler, D.E., Gupta, R.K., Kjærgaard, M.B., Srivastava, M.B., Whitehouse, K.: Brick: Towards a unified metadata schema for buildings. In: Proceedings of the 3rd ACM international conference on systems for energy-efficient built environments, BuildSys@SenSys 2016, palo alto, CA, USA, november 16-17, 2016. pp. 41–50. ACM (2016). https://doi.org/10.1145/2993422.2993577.
- Rasmussen, M.H., Lefrançois, M., Schneider, G.F., Pauwels, P.: BOT: The building topology ontology of the W3C linked building data group. Semantic Web. 12, 143–161 (2021). https://doi.org/10.3233/SW-200385.
- Pritoni, M., Paine, D., Fierro, G., Mosiman, C., Poplawski, M., Saha, A., Bender, J., Granderson, J.: Metadata schemas and ontologies for building energy applications: A critical review and use case analysis. Energies. 14, (2021). https://doi.org/10.3390/en14072024.
- Fokaides, P.A., Panteli, C., Panayidou, A.: How are the smart readiness indicators expected to affect the energy performance of buildings: First evidence and perspectives. Sustainability. 12, (2020). https://doi.org/10.3390/su12229496.
- Vigna, I., Pernetti, R., Pernigotto, G., Gasparella, A.: Analysis of the building smart readiness indicator calculation: A comparative case-study with two panels of experts. Energies. 13, (2020). https://doi.org/10.3390/en13112796.
- Märzinger, T., Österreicher, D.: Supporting the smart readiness indicator—a methodology to integrate a quantitative assessment of the load shifting potential of smart buildings. Energies. 12, (2019). https://doi.org/10.3390/en12101955.
- Janhunen, E., Pulkka, L., Säynäjoki, A., Junnila, S.: Applicability of the smart readiness indicator for cold climate countries. Buildings. 9, (2019). https://doi.org/10.3390/buildings9040102.
- Ramezani, B., Silva, Manuel.G. da, Simões, N.: Application of smart readiness indicator for mediterranean buildings in retrofitting actions. Energy and Buildings. 249, 111173 (2021). https://doi.org/10.1016/j.enbuild.2021.111173.
- Hammar, K., Wallin, E.O., Karlberg, P., Hälleberg, D.: The RealEstateCore ontology. In: Ghidini, C., Hartig, O., Maleshkova, M., Svátek, V., Cruz, I.F., Hogan, A., Song, J., Lefrançois, M., and Gandon, F. (eds.) The semantic web - ISWC 2019 - 18th international semantic web conference, proceedings, part II. pp. 130–145. Springer (2019). https://doi.org/10.1007/978-3-030-30796-7\_9.
- García-Castro, R., Lefrançois, M., Poveda-Villalón, M., Daniele, L.: The ETSI SAREF ontology for smart applications: A long path of development and evolution. In: Energy smart appliances. pp. 183–215. John Wiley & Sons, Ltd (2023). https://doi.org/10.1002/9781119899457.ch7.
- Poveda-Villalón, M., Garcı́a-Castro, R.: Extending the SAREF ontology for building devices and topology. In: Poveda-Villalón, M., Pauwels, P., and Roxin, A. (eds.) Proceedings of the 6th linked data in architecture and construction workshop, london, united kingdom, june 19-21, 2018. pp. 16–23. CEUR-WS.org (2018).
- Poveda-Villalón, M., Fernández-Izquierdo, A., Fernández-López, M., Garcı́a-Castro, R.: LOT: An industrial oriented ontology engineering framework. Eng. Appl. Artif. Intell. 111, 104755 (2022). https://doi.org/10.1016/J.ENGAPPAI.2022.104755.
- Reynolds, D., Cyganiak, R.: The RDF data cube vocabulary. W3C (2014).
- Bechhofer, S., Miles, A.: SKOS simple knowledge organization system reference. W3C (2009).
- Sahoo, S., McGuinness, D., Lebo, T.: PROV-O: The PROV ontology. W3C (2013).
- Alobaid, A., Garijo, D., Poveda-Villalón, M., Santana-Perez, I., Fernández-Izquierdo, A., Corcho, O.: Automating ontology engineering support activities with OnToology. Journal of Web Semantics. 57, 100472 (2019). https://doi.org/10.1016/j.websem.2018.09.003.
- Vandenbussche, P.-Y., Atemezing, G.A., Poveda-Villalón, M., Vatant, B.: Linked open vocabularies (LOV): A gateway to reusable semantic vocabularies on the web. Semantic Web. 8, 437–452 (2017). https://doi.org/10.3233/SW-160213.
- Garijo, D., Corcho, O., Poveda-Villalón, M.: FOOPS!: An ontology pitfall scanner for the FAIR principles. In: International semantic web conference (ISWC) 2021: Posters, demos, and industry tracks. CEUR-WS.org (2021).
Notes
https://energy.ec.europa.eu/topics/energy-strategy/clean-energy-all-europeans-package_en↩︎
https://energy.ec.europa.eu/topics/energy-efficiency/energy-efficient-buildings/smart-readiness-indicator_en↩︎
https://energy.ec.europa.eu/topics/energy-efficiency/energy-efficient-buildings/smart-readiness-indicator/sri-implementation-tools_en#sri-digital-calculation-tools↩︎
https://energy.ec.europa.eu/topics/energy-efficiency/energy-efficient-buildings/smart-readiness-indicator/sri-eu-countries_en↩︎
https://ec.europa.eu/newsroom/ener/newsletter-archives/52491↩︎
https://github.com/w3c/shacl/blob/master/shapes/datacube.shapes.ttl.↩︎
A bug report has been submitted.↩︎
Can be requested as part of the SRI assessment package: https://ec.europa.eu/eusurvey/runner/SRI-assessment-package.↩︎