Symbolic-AI driven Data Repairs for Large Scale Energy Co-Simulations: Combining SHACL repairs and Datalog rules to detect, explain, and correct errors in large scale energy co-simulation setups
Abstract
The transformation of energy distribution systems is fostering new models, like renewable energy communities, which require complex, simulation-based feasibility assessments. Preparing these simulations is often labor-intensive and error-prone due to heterogeneous actors and location-specific grid topologies. This paper proposes a symbolic AI approach that combines SHACL (repairs) and Datalog (imputation) to semi-automatically detect, explain, and correct inconsistencies for grid and sensor data so it can serve as input for co-simulations. Applied within the DataBri-X project and tested using Siemens BIFROST, the approach demonstrates promising improvements in data quality and preprocessing efficiency.
1 Introduction
Energy distribution systems are rapidly changing with the emergence of new technologies, actors, and business models. Smart Grid simulation tools are crucial for analyzing the impact of these changes. Several simulation platforms have been developed, each providing unique features [1]. These tools require topological data (grid model) and time series inputs (e.g. weather data, load profiles) to run co-simulations.
Preparing such simulations presents a challenge, because they are difficult to set up due to their complexity and therefore require significant manual effort, making this process not only time-consuming but also error-prone. This underlines the need for data management tools to organize and preprocess simulation data in order to reduce the risk of errors that could require reruns or potentially lead to financial losses due to incorrect simulation results.
For the co-simulations to work correctly, the grid topology needs to correctly reflect the real-world situation regarding the components that form the energy grid. Sensor data consists of a series of data points, called observations, which were measured at a certain point in time and yield some kind of value. They are associated with a property of what is observed, such as the atmospheric temperature at a specific location or the electric power consumed by a household. Problems with sensor data arise from missing values, invalid measurements, and outliers.
This paper demonstrates how symbolic AI technologies can be leveraged for simulation data to detect errors, highlight them, and correct erroneous or flawed data. We have developed a symbolic AI application to detect and fix erroneous or incomplete data by first integrating all data relevant to the simulation by mapping it to RDF and then applying a combination of SHACL repairs and Datalog rules on the connected data to i) delete data items representing sensor measurement errors or inconsistently assembled grid structures, ii) suggest missing structures in the energy grid topology, explaining to users how the grid structure can be consistently completed, and iii) add data items for missing sensor data using missing value imputation. Our application has been implemented and tested with real-world data in conjunction with the co-simulation tool BIFROST [2], where its benefits for data quality could be observed, thereby showing readiness for future field trials.
3 A Methodology for Co-Simulation Data Quality
To cope with the challenges for BIFROST smart grid co-simulations with respect to data quality, we propose an approach which combines SHACL validation and repairs with methods of imputation using Datalog [8], specifically the RDFox Datalog engine [9], into a hybrid symbolic AI application. We chose these standardized technologies because they can be effectively applied to RDF data in combination.
3.1 Repairing the Grid Topology
Providing explanations for SHACL violations is highly beneficial, as it is important for users to understand the problems in a given topology in order to select the best way to correct it.
We use the previously published SHACL repair program [10] for explaining such problems in the grid topology and propose solutions. The proposed repairs show how grid data needs to be added to conform to the constraints. They also propose deletions of invalid parts of the grid structure.
For the implementation, we first define terms for the simulation infrastructure based on the JSON schema of the BIFROST infrastructure data as an OWL ontology. We deliberately refrained from using existing ontologies in this context as this would increase the conversion efforts from and to the BIFROST data model and the ontology will not be utilized outside of correcting the topology. Fig. 1 shows an overview of the main classes and properties.

For time series data the SOSA/SSN1 ontology is internally used as a schema for the RDF graph.
Several SHACL shapes enable the application to find invalid data and explain violations. Qualified shapes ensure correct cardinalities of properties between different types of structures and dynamics, so that they are correctly connected to each other. For example, every instance of :SOLAR-PANEL must have exactly one dynamic :ACTIVE-POWER-3P associated via the property :hasDynamic, as shown in the SHACL shape below:
node:SOLAR-PANEL a sh:NodeShape; sh:targetClass :SOLAR-PANEL;
    sh:property property:hasDynamic_ACTIVE_POWER_3P_1_1 .
property:hasDynamic_ACTIVE_POWER_3P_1_1 a sh:PropertyShape;
    sh:path :hasDynamic; sh:qualifiedMinCount 1; sh:qualifiedMaxCount 1;
    sh:qualifiedValueShape [ sh:class :ACTIVE-POWER-3P ] .
If violations are found, the application uses SHACL repairs to determine explanations for how to change the data graph to achieve conformance with the constraints.
The user is shown the explanations and recommendations to help fix violations and ensure consistency of the topology. For example, if a solar panel ex:sp1 a :SOLAR-PANEL is missing the active power dynamic, the application would recommend to add the following triples, including adding a new node ex:new1 with class member ship in :ACTIVE-POWER-3P to connect the structure:
ex:sp1 :hasDynamic ex:new1 . ex:new1 a :ACTIVE-POWER-3P .3.2 Time Series Data Repair
We address the problem of missing time series observations as well as invalid and outlier values with a set of Datalog rules to complement the SHACL repairs. The application uses a stepwise approach. First, we remove invalid existing data using SHACL repairs. Second, we add missing observations using Datalog rules. Third, we estimate missing values. In general, when imputing missing values in time series data, one can choose from different existing strategies.
Step 1: Repairing existing Observation Values.
For fixing invalid values (NaN) and outliers (values outside of an interval of 0 to 50) of the property sosa:hasSimpleResult, we use a SHACL shape and let the SHACL repairs delete the violating values.
node:OBSERVATION_VALUES a sh:NodeShape;
    sh:targetClass sosa:Observation;
    sh:property [
        sh:path sosa:hasSimpleResult;
        sh:minInclusive "0"^^xsd:float; sh:maxInclusive "50"^^xsd:float; ] .
Step 2: Add missing Observations.
We use Datalog rules to create instances of sosa:Observation for the missing observations with a corresponding timestamp. We perform date/time arithmetics, adding 15 minutes to timestamps of existing observations. If no observation with that following timestamp exists (and the timestamp is not later than a defined maximum), a new observation is created by a rule.
Step 3: Imputing new Observation Values.
For adding missing values of observations, we chose linear interpolation as a simple approach and added a Datalog rule, which implements the imputation for a gap of one or more missing values. Basic arithmetic built-in functions, as found in many Datalog engines, are sufficient for the calculation, and the values are guaranteed to be in the valid range. Generally, the method of imputation can be adapted to different use cases by changing the calculation in the Datalog rule.
The variables are defined as: is the time at the last gap start, is the time at the next gap end, is the time of the missing value, is the result value at gap start, is the result value at gap end, and is the interpolated value. The following RDFox Datalog rule implements this linear interpolation:
[?obs, sosa:hasSimpleResult, ?Rnew] :-
    AGGREGATE(
        [?obs, a, :Missing], [?obs, sosa:resultTime, ?T],
        [?gapStart, a, :GapStart], [?gapStart, sosa:resultTime, ?Tgs],
        FILTER(?Tgs < ?T) ON ?obs
    BIND MAX(?Tgs) AS ?Tlgs
    BIND MAX_ARGMAX(?gapStart, ?Tgs) AS ?lastGapStart
    BIND MAX_ARGMAX(?T, ?Tgs) AS ?Tm),
        [?lastGapStart, sosa:hasSimpleResult, ?Rlgs], [?lastGapStart, :hasGapEnd, ?nextGapEnd],
        [?nextGapEnd, sosa:hasSimpleResult, ?Rnge], [?nextGapEnd, sosa:resultTime, ?Tnge],
    BIND(?Rlgs*((?Tnge - ?Tm)/(?Tnge - ?Tlgs)) + ?Rnge*((?Tm - ?Tlgs)/(?Tnge - ?Tlgs)) AS ?Rnew) .
After this step, the time series data contains observations for every 15 minutes and each observation has a valid value to be used in the co-simulation. The complete Datalog rule set for steps 2 and 3 is available online.2
4 Evaluation
The evaluation was performed with a BIFROST grid topology and real-world time series data.
Topology Data: For the topological data, a low-voltage grid section was prepared for the BIFROST co-simulation framework [2], which was derived from the smart grid benchmark dataset [11]. It corresponds to a rural settlement with a total of 13 buildings (which include PV and EV-charging). For validation, the topology was altered by disconnecting 4 buildings (load and PV) from the grid. BIFROST itself does not implement checks in this regard, meaning that disconnected loads will not be considered in the load flow.
In Figure 2 (a) the impact of the loads that were disconnected on the load flow are shown: orange shows a simulation with the buildings being connected, blue the result of a simulation when the 4 loads are disconnected. As can be seen, disconnected loads and generations can have significant impacts on the power flow in a grid. The SHACL repairs are able to identify the missing connections and report back four violations, including proposals how to correct them as described in Section 3.1. Time Series Data: For the time series data, a standard load profile for a household on a weekday from the the German federal association of the energy and Water industry (BDEW) was used3. The time series constitutes the load of a building during a workday with a time resolution of 15 minutes (i.e., amounting to a total of 96 data-points).
BIFROST implements error handling regarding time series and will use the last known value in the simulation until an update occurs. An error was introduced into the time series by deleting the values between 7:00 am and 9:30 am. The resulting evolution of the load original (green), last-known-value (orange) and interpolation (blue) is shown in Figure 2 (b).
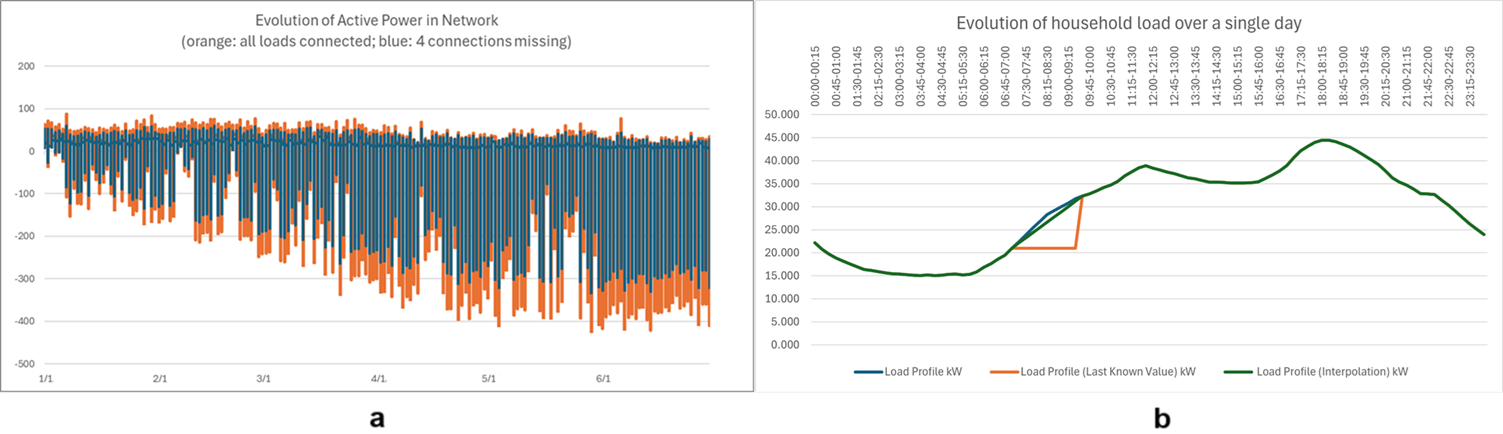
The last known and valid value leads to a deviation (approx. 60kW) from the ground truth. Linear interpolation, such as that performed by our approach, reduces this difference significantly to 9 kW. The application is also able to detect NaN’s as well as values which are clearly out of range. For the test data, the time series was corrupted by changing the value at 04:00 in the morning to .
The corrupted time series was repaired using the application. The missing time point is added. The invalid value, i.e. outlier, is removed. Then, missing values are imputed, resulting in observations as shown below.
[] a sosa:Observation ;
    sosa:hasFeatureOfInterest <urn:uuid:1dd4760c-d5ee-5cd7-8ac4-8e08373fde78> ;
    sosa:hasSimpleResult "15.0475006"^^xsd:float ;
    sosa:resultTime "1970-01-01T04:00:00"^^xsd:dateTime .
5 Conclusions and Outlook
In this paper, we presented a symbolic AI application to manage data quality for energy co-simulations using a combined approach of SHACL repairs and Datalog rules. We evaluated our approach with the BIFROST co-simulation tool, where our symbolic AI application was able to identify, explain, and correct errors. Future work will be to evaluate our approach in real-world scenarios and determine how well it can solve erroneous simulation data in practice.
Acknowledgments..
This work is partially supported by the HORIZON Europe programme project DataBri-X (grant agreement 101070069).
Declaration on Generative AI..
The author(s) have not employed any Generative AI tools.
References
- Vogt, M., Marten, F., Braun, M.: A survey and statistical analysis of smart grid co-simulations. Applied energy. 222, 67–78 (2018). https://doi.org/10.1016/j.apenergy.2018.03.123.
- Mosshammer, R., Diwold, K., Einfalt, A., Schwarz, J., Zehrfeldt, B.: Bifrost: A smart city planning and simulation tool. In: Intelligent human systems integration 2019: Proceedings of the 2nd international conference on intelligent human systems integration (IHSI 2019): Integrating people and intelligent systems, february 7-10, 2019, san diego, california, USA. pp. 217–222. Springer (2019). https://doi.org/10.1007/978-3-030-11051-2_33.
- Donders, A.R.T., Van Der Heijden, G.J., Stijnen, T., Moons, K.G.: A gentle introduction to imputation of missing values. Journal of clinical epidemiology. 59, 1087–1091 (2006). https://doi.org/10.1016/j.jclinepi.2006.01.014.
- Bischof, S., Polleres, A.: RDFS with attribute equations via SPARQL rewriting. In: Extended semantic web conference. pp. 335–350. Springer (2013). https://doi.org/10.1007/978-3-642-38288-8_23.
- Bischof, S., Martin, C., Polleres, A., Schneider, P.: Collecting, integrating, enriching and republishing open city data as linked data. In: International semantic web conference. pp. 57–75. Springer (2015). https://doi.org/10.1007/978-3-319-25010-6_4.
- Bischof, S., Harth, A., Kämpgen, B., Polleres, A., Schneider, P.: Enriching integrated statistical open city data by combining equational knowledge and missing value imputation. Journal of Web Semantics. 48, 22–47 (2018). https://doi.org/10.1016/j.websem.2017.09.003.
- Nenadić, K.R., Gavrić, M.M., urević, V.I.: Validation of CIM datasets using SHACL. In: 2017 25th telecommunication forum (TELFOR). pp. 1–4. IEEE (2017). https://doi.org/10.1109/TELFOR.2017.8249433.
- Abiteboul, S., Hull, R., Vianu, V.: Foundations of databases. Addison-Wesley Reading (1995).
- Nenov, Y., Piro, R., Motik, B., Horrocks, I., Wu, Z., Banerjee, J.: RDFox: A highly-scalable RDF store. In: The semantic web-ISWC 2015: 14th international semantic web conference, bethlehem, PA, USA, october 11-15, 2015, proceedings, part II 14. pp. 3–20. Springer (2015). https://doi.org/10.1007/978-3-319-25010-6_1.
- Ahmetaj, S., David, R., Polleres, A., Šimkus, M.: Repairing SHACL Constraint Violations Using Answer Set Programming. In: ISWC 2022. pp. 375–391 (2022). https://doi.org/10.1007/978-3-031-19433-7\_22.
- Meinecke, S., Sarajlić, D., Drauz, S.R., Klettke, A., Lauven, L.-P., Rehtanz, C., Moser, A., Braun, M.: Simbench—a benchmark dataset of electric power systems to compare innovative solutions based on power flow analysis. Energies. 13, 3290 (2020). https://doi.org/10.3390/en13123290.